Reports
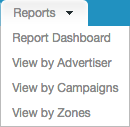
To view advertisement reports press the Reports Tab. This tab allows you to review which ads are receiving the most attention based on a variety of different variables. The reports tab features a drop down that allows you to view different kinds of reports.

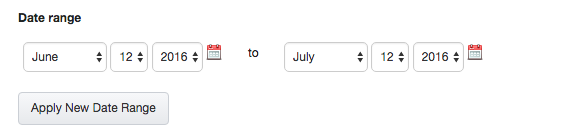
In each series of reports you are able to select the Date Range. The date range displays the data over the course of days of your choosing, or just one day. Use the drop down selectors to choose the days you wish to view, and click the Apply New Date Range button.
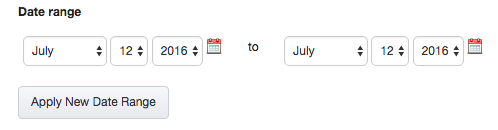
Note: To choose the data for only one day, select the same date for BOTH date selectors.
Reports Dashboard
Reports Dashboard is a general report across all advertisements. This can be accessed from the reports tab, or by clicking Reports Dashboard in the right hand column upon entering the reports tab.
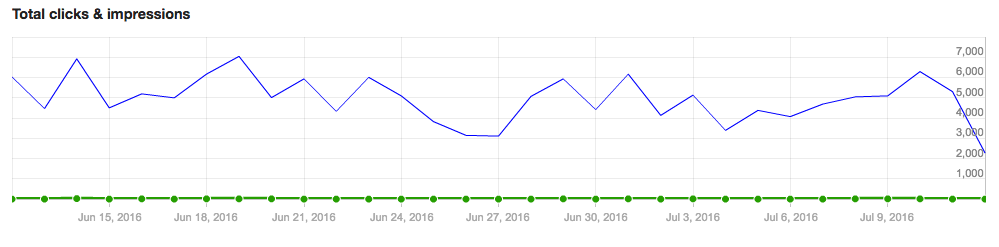
Seven graphs are displayed on this page.
The first graph, the line graph, displays the total number of clicks & impressions for each day for a span of a month.
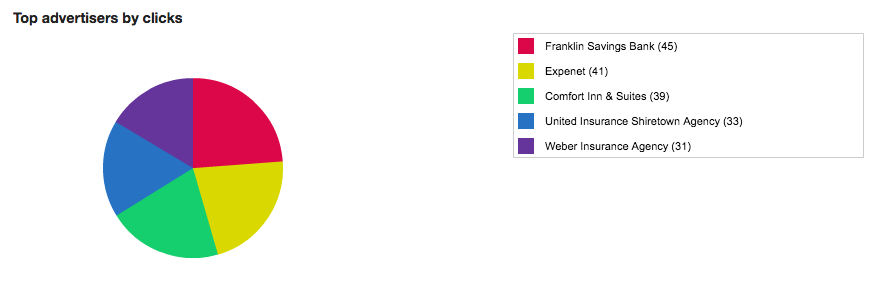
The second graph, a pie chart, displays the Top Advertisers by clicks for the amount of time selected.
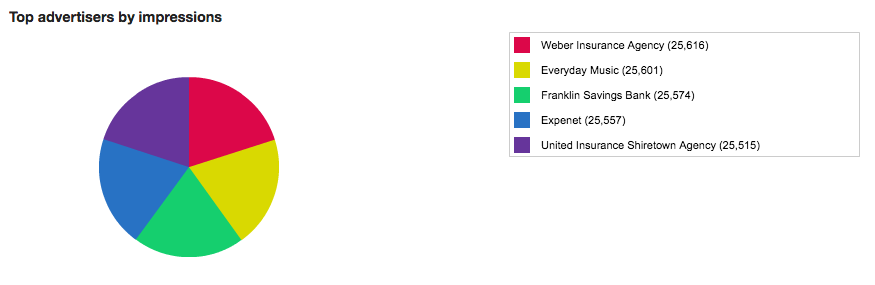
The third graph displays the top advertisers by impressions.
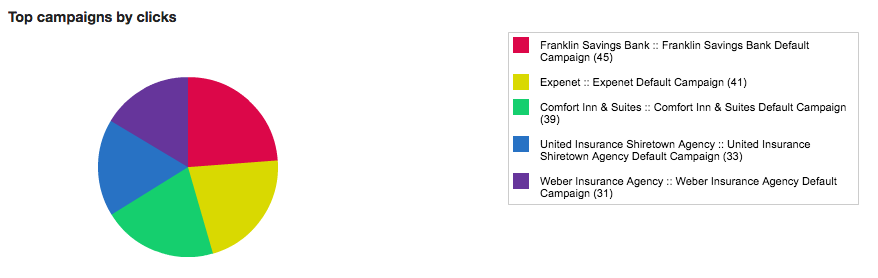
The fourth displays the top campaigns by clicks.
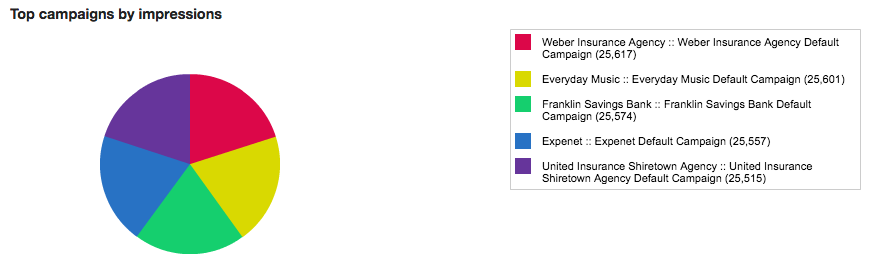
The fifth displays the top campaigns by impressions.
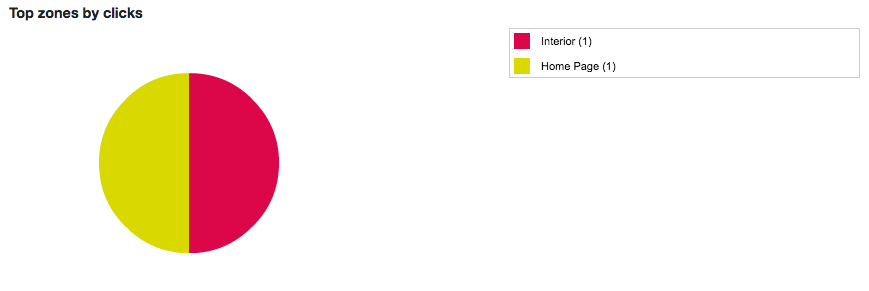
The sixth displays the top zones by clicks.
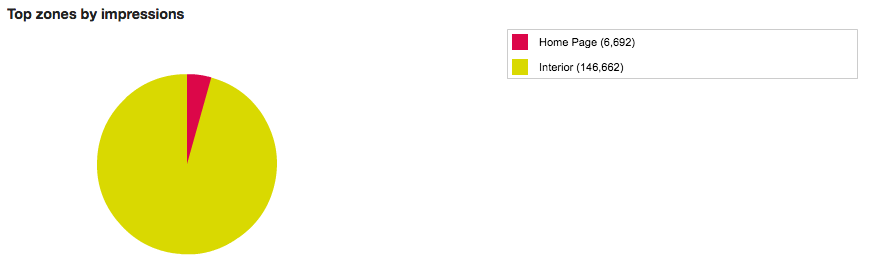
And the seventh displays the top zones by impressions.
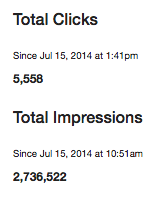
Also displayed here is the Total Clicks and the Total impressions overall.

View by Advertiser
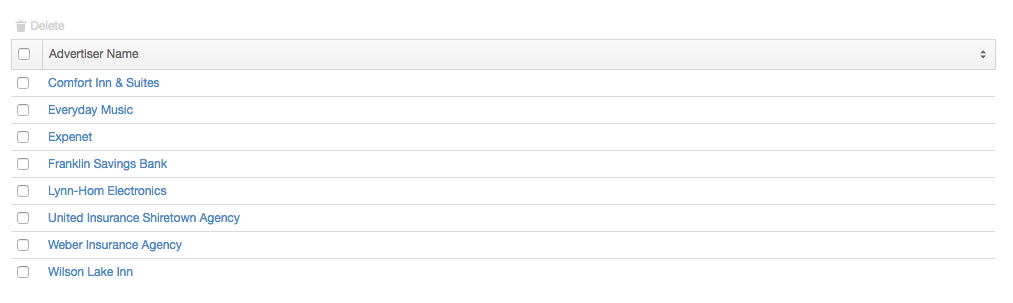
View by advertiser allows you to see individual reports for each advertiser. Either click View by Advertiser in the reports tab or View by Advertiser in the right hand column in the reports page to view your advertiser list.
When you are in your advertiser list, select the advertiser you would like to view reports on.
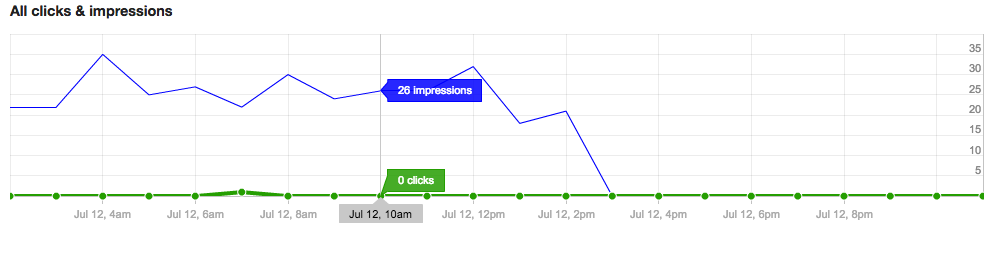
Once you select your advertiser, you will be shown 5 graphs.
The first graph will show the the total amount of clicks and impressions over the span of the last month.
The second graph will show you the top campaigns by clicks for your advertiser.

The third graph will report the top campaigns by impressions for your advertiser.
The fourth graph will show you the top zones used by your advertiser.
Top fifth graph will show you the top zones by impressions used by your advertiser.
The total clicks and total impressions show the total number of clicks and impressions for your advertiser.
View by Campaign
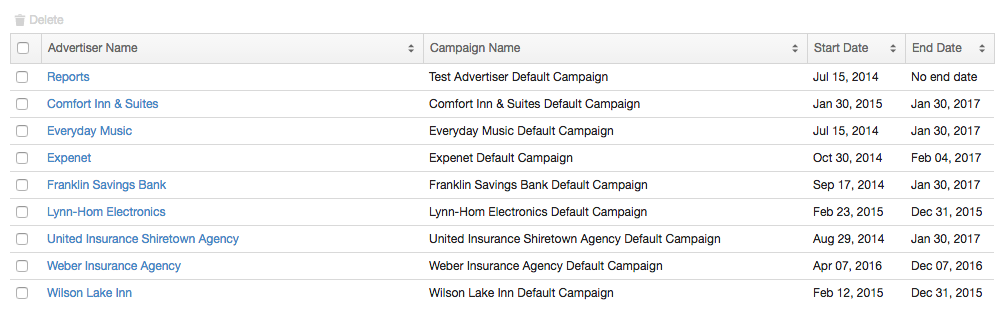
View by campaign allows you to view the reports for your campaigns. To view your campaign reports, either click View by Campaign from the reports tab or from the right hand column in the reports page.
This will bring up your campaigns. Select the campaign name you wish to view.
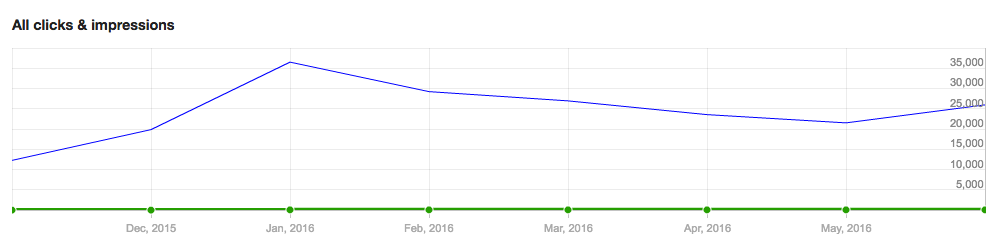
This will bring up a series of 5 graphs. The first graph shows you the total amount of clicks and impressions over the span of the last month for your campaign.
The second graph shows you The top advertisers by clicks for your campaign.
The third graph shows you the top advertisers by impressions for your campaign.
The fourth graph shows you the top zones by clicks for your campaign.
The fifth graph shows you the top zones by impressions for your campaign.
Total clicks and total impressions for your campaign are displayed at the bottom of the page.
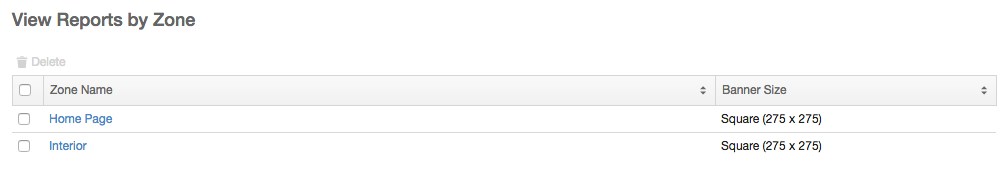
View by Zone
View reports by zone allows you to review the reports for your zones. TO view your zone reports, either click View by Zone from the reports tab or from the right hand column in the reports page.
This will bring you to your Zone names. Select the zone you wish to review reports on by clicking the zone’s name.
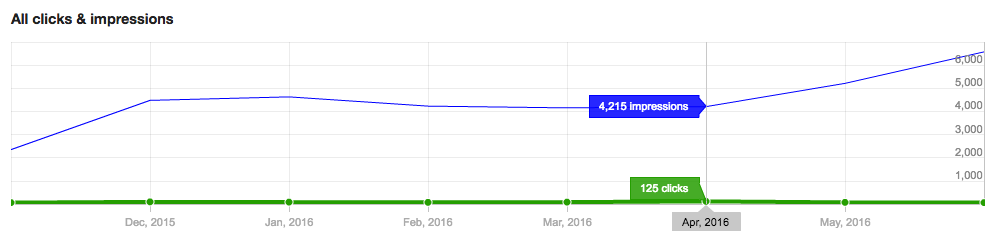
Here you are able to view 5 graphs. The first graph allows you to view total clicks and impressions for your zone.
The second graph shows you the top advertisers for your zone by clicks.
The third graph allows you to view the top advertisers by impressions for your zone.
The fourth graph allows you to view the top campaigns by clicks for your zone.
The fifth graph allows you to view the top campaigns by impressions for your zone.
The total clicks and total impressions for your zone can be found at the bottom of the page.